- Overview
- The DevTools Page
- Creating a DevTools Extension
- DevTools UI Elements: Panels and Sidebar Panes
- Communicating Between Extension Components
Overview
A DevTools extension adds functionality to the Web Inspector included with Opera. It can add new UI panels and sidebars, interact with the inspected page, get information about network requests, and more. DevTools extensions have access to an additional set of DevTools-specific extension APIs:
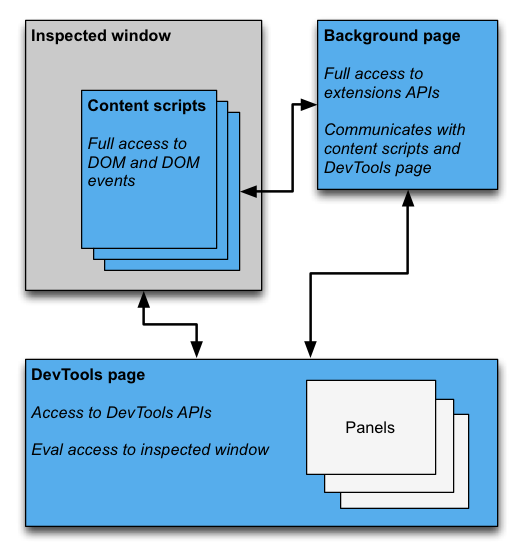
A DevTools extension is structured like any other extension: it can have a background page, content scripts, and other items. In addition, each DevTools extension has a DevTools page, which has access to the DevTools APIs.

The DevTools page
An instance of the extension’s DevTools page is created each time a DevTools window opens. The DevTools page exists for the lifetime of the DevTools window. The DevTools page has access to the DevTools APIs and a limited set of extension APIs. Specifically, the DevTools page can:
- Create and interact with panels using the
devtools.panelsAPIs. - Get information about the inspected window and evaluate code in the inspected window using the
devtools.inspectedWindowAPIs. - Get information about network requests using the
devtools.networkAPIs.
The DevTools page cannot use most of the extensions APIs directly. It has access to the same subset of the extension and runtime APIs that a content script has access to. Like a content script, a DevTools page can communicate with the background page using Message Passing. For an example, see Injecting a Content Script.
Creating a DevTools extension
To create a DevTools page for your extension, add the devtools_page field in the extension manifest:
{
	"name": "My Extension"
	"version": "1.0",
	"devtools_page": "devtools.html"
}
An instance of the devtools_page specified in your extension’s manifest is created for every DevTools window opened. The page may add other extension pages as panels and sidebars to the DevTools window using the devtools.panels API.
The devtools_page field must point to an HTML page. This differs from the background field, used for specifying a background page, which lets you specify JavaScript files directly.
The chrome.devtools.* API modules are available only to the pages loaded within the DevTools window. Content scripts and other extension pages do not have these APIs. Thus, the APIs are available only through the lifetime of the DevTools window.
DevTools UI elements: panels and sidebar panes
In addition to the usual extension UI elements, such as browser actions, context menus and popups, a DevTools extension can add UI elements to the DevTools window:
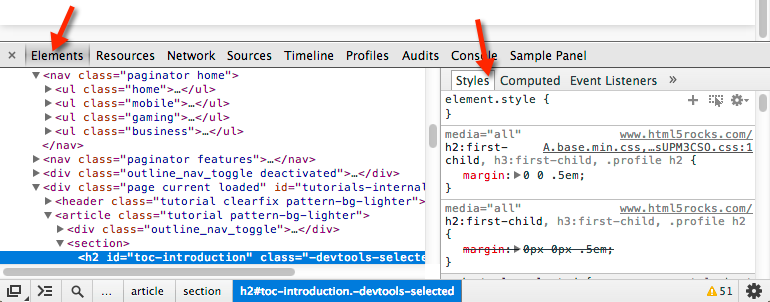
- A panel is a top-level tab, like the Elements, Sources, and Network panels.
- A sidebar pane presents supplementary UI related to a panel. The Styles, Computed Styles, and Event Listeners panes on the Elements panel are examples of sidebar panes. Currently your extension can only add sidebar panes to the Elements panel. (Note that the appearance of sidebar panes may not match the image, depending on the version of Opera you’re using, and where the DevTools window is docked.)

Each panel is its own HTML file, which can include other resources (JavaScript, CSS, images, and so on). Creating a basic panel looks like this:
chrome.devtools.panels.create(
	'My Panel',
	'my-panel-icon.png',
	'panel.html',
	function(panel) {
		// Сode invoked on panel creation
	}
);
JavaScript executed in a panel or sidebar pane has access to the the same APIs as the DevTools page.
Creating a basic sidebar pane for the Elements panel looks like this:
chrome.devtools.panels.elements.createSidebarPane(
	'My Sidebar',
	function(sidebar) {
		// Sidebar initialization code here
		sidebar.setObject({
			some_data: 'Some data to show'
		});
	}
);
There are several ways to display content in a sidebar pane:
- HTML content. Call
setPageto specify an HTML page to display in the pane. - JSON data. Pass a JSON object to
setObject. - JavaScript expression. Pass an expression to
setExpression. DevTools evaluates the expression in the context of the inspected page, and displays the return value.
For both setObject and setExpression, the pane displays the value as it would appear in the DevTools console. However, setExpression lets you display DOM elements and arbitrary JavaScript objects, while setObject only supports JSON objects.
Communicating between extension components
The following sections describe some typical scenarios for communicating between the different components of a DevTools extension.
Injecting a Content Script
The DevTools page can’t call tabs.executeScript directly. To inject a content script from the DevTools page, you must retrieve the ID of the inspected window’s tab using the inspectedWindow.tabId property and send a message to the background page. From the background page, call tabs.executeScript to inject the script.
If a content script has already been injected, you can add additional context scripts using the eval method. See Passing the Selected Element to a Content Script for more information.
The following code snippets show how to inject a content script using executeScript.
// DevTools page — devtools.js
// Create a connection to the background page
var backgroundPageConnection = chrome.runtime.connect({
	name: 'devtools-page'
});

backgroundPageConnection.onMessage.addListener(function (message) {
	// Handle responses from the background page, if any
});

// Relay the tab ID to the background page
chrome.runtime.sendMessage({
	tabId: chrome.devtools.inspectedWindow.tabId,
	scriptToInject: 'content_script.js'
});
Code for the background page:
// Background page — background.js
chrome.runtime.onConnect.addListener(function(devToolsConnection) {
	// Assign the listener function to a variable
	// so we can remove it later
	var devToolsListener = function(message, sender, sendResponse) {
		// Inject a content script into the identified tab
		chrome.tabs.executeScript(message.tabId, {
			file: message.scriptToInject
		});
	}
	// Add the listener
	devToolsConnection.onMessage.addListener(devToolsListener);

	devToolsConnection.onDisconnect(function() {
		devToolsConnection.onMessage.removeListener(devToolsListener);
	});
}
Evaluating JavaScript in the Inspected Window
You can use the inspectedWindow.eval method to execute JavaScript code in the context of the inspected page. You can invoke the eval method from a DevTools page, panel or sidebar pane.
By default, the expression is evaluated in the context of the main frame of the page. Use the useContentScriptContext: true option to evaluate the expression in the same context as the content scripts.
Calling eval with useContentScriptContext: true does not create a content script context, so you must load a context script before calling eval, either by calling executeScript or by specifying a content script in the manifest.json file.
Once the context script context exists, you can use this option to inject additional content scripts.
The eval method is powerful when used in the right context and dangerous when used inappropriately. Use the tabs.executeScript method if you don’t need access to the JavaScript context of the inspected page. For detailed cautions and a comparison of the two methods, see devtools.inspectedWindow.
Passing the Selected Element to a Content Script
The content script doesn’t have direct access to the current selected element. However, any code you execute using inspectedWindow.eval has access to the DevTools console and command-line APIs. For example, in evaluated code you can use $0 to access the selected element.
To pass the selected element to a content script:
- Create a method in the content script that takes the selected element as an argument.
- Call the method from the DevTools page using
inspectedWindow.evalwith theuseContentScriptContext: trueoption.
The code in your content script might look something like this:
function setSelectedElement(el) {
	// Do something with the selected element
}
Invoke the method from the DevTools page like this:
chrome.devtools.inspectedWindow.eval('setSelectedElement($0)', {
	useContentScriptContext: true
});
The useContentScriptContext: true option specifies that the expression must be evaluated in the same context as the content scripts, so it can access the setSelectedElement method.
Messaging from Content Scripts to the DevTools Page
Messaging between the DevTools page and content scripts is indirect, by way of the background page.
When sending a message to a content script, the background page can use the tabs.sendMessage method, which directs a message to the content scripts in a specific tab, as shown in Injecting a Content Script.
When sending a message from a content script, there is no ready-made method to deliver a message to the correct DevTools page instance associated with the current tab. As a workaround, you can have the DevTools page establish a long-lived connection with the background page, and have the background page keep a map of tab IDs to connections, so it can route each message to the correct connection.
// background.js
var connections = {};

chrome.runtime.onConnect.addListener(function (port) {
	var extensionListener = function (message, sender, sendResponse) {

	// The original connection event doesn’t include
	// the tab ID of the DevTools page, so we need
	// to send it explicitly.
	if (message.name == 'init') {
		connections[message.tabId] = port;
		return;
	}

	// Other message handling
}

// Listen to messages sent from the DevTools page
port.onMessage.addListener(extensionListener);
	port.onDisconnect.addListener(function(port) {
		port.onMessage.removeListener(extensionListener);

		var tabs = Object.keys(connections);
		for (var i = 0, len = tabs.length; i < len; i++) {
			if (connections[tabs[i]] == port) {
				delete connections[tabs[i]]
				break;
			}
		}
	});
});

// Receive message from content script and
// relay to the devTools page for the current tab
chrome.runtime.onMessage.addListener(function(request, sender, sendResponse) {
	// Messages from content scripts should have sender.tab set
	if (sender.tab) {
		var tabId = sender.tab.id;
		if (tabId in connections) {
			connections[tabId].postMessage(request);
		} else {
			console.log('Tab not found in connection list');
		}
	} else {
		console.log('sender.tab not defined');
	}
	return true;
});
The DevTools page (or panel or sidebar pane) establishes the connection like this:
// Create a connection to the background page
var backgroundPageConnection = chrome.runtime.connect({
	name: 'panel'
});

backgroundPageConnection.postMessage({
	name: 'init',
	tabId: chrome.devtools.inspectedWindow.tabId
});
Detecting When DevTools Opens and Closes
If your extension needs to track whether the DevTools window is open, you can add an onConnect listener to the background page, and call connect from the DevTools page. Since each tab can have its own DevTools window open, you may receive multiple connect events. To track whether any DevTools window is open, you need to count the connect and disconnect events as shown below:
// background.js
var openCount = 0;
chrome.runtime.onConnect.addListener(function (port) {
	if (port.name == 'devtools-page') {
		if (openCount == 0) {
			alert('DevTools window opening');
		}
		openCount++;

		port.onDisconnect.addListener(function(port) {
			openCount--;
			if (openCount == 0) {
				alert('Last DevTools window closing');
			}
		});
	}
});
The DevTools page creates a connection like this:
// devtools.js
// Create a connection to the background page
var backgroundPageConnection = chrome.runtime.connect({
	name: 'devtools-page'
});